Procedure
|
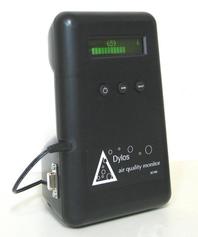
Materials:
-extension cord - Dylos Air Quality Monitor - adaptor |
Data Collection Method:
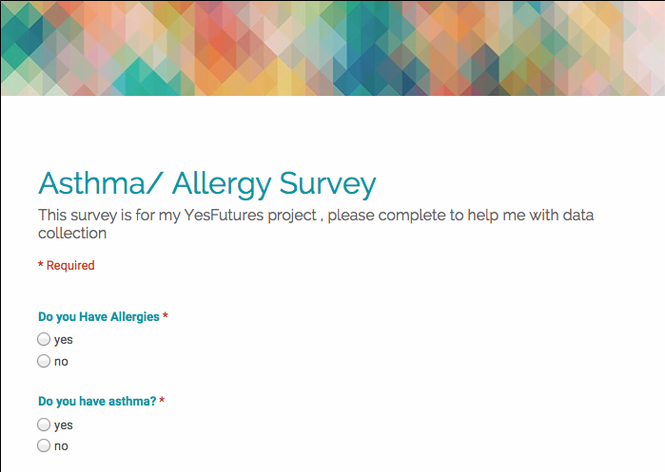
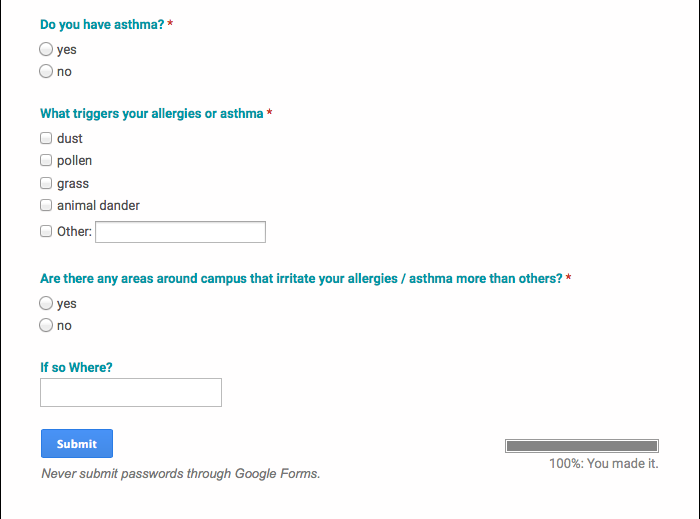
Pre-Survey
Results: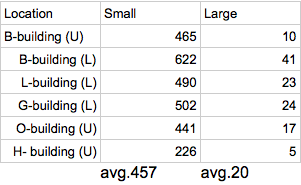
Analysis: What was observe from the following location?
I was correct about the locations around the school where there would be more particulates. those areas were G building and lower B building. another thing i observed was the areas where particulates were more prominent were near trees or areas where lots of construction or building happen. |
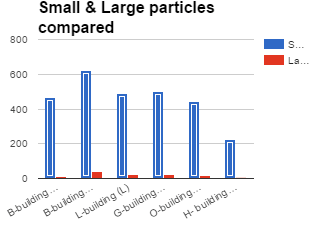
· What are the findings from the data gathered?
The average quality of the air around Mililani High School is poor, according to the air quality chart provided by Dylos company. The Average amount of small particles detected was 457 and by that standard anything between 350-1000 is considered poor quality air. |
